
Environmental Sustainability|Greenhouse Gas Emission



Nuvoton actively reduce the environmental impact of our business operations by investing in innovative technologies and initiating layouts for renewable energy and net carbon zero emissions. We enhance resource use efficiency and implement waste management to respond to the continuously evolving international environmental regulations, extreme climate events, and other risks. By estimating financial impacts and planning management costs in advance, we formulate environmental strategies and build operational resilience for the company.


48.8
%
Approved SBTi Near-Term Target: Commitment to Reduce Scope 1 and 2 Emissions by 2030 Compared to the 2022 Baseline
25
%
Approved SBTi Near-Term Target: Commitment to Reduce Scope 3 Emissions by 2030 Compared to the 2023 Baseline
1163000
kWh
Nuvoton Taiwan's Annual Electricity Saving Achievement in 2024
Greenhouse Gas Management
Nuvoton has established a greenhouse gas (GHG) inventory mechanism in accordance with ISO 14064-1 standards and the guidelines of Taiwan's Environmental Protection Administration (EPA). Since 2009, Nuvoton Taiwan has regularly conducted Scope 1 and Scope 2 GHG inventories based on ISO 14064-1 and obtained third-party verification. Starting in 2023, Nuvoton Japan adopted the same inventory and verification practices to ensure data credibility and reporting quality.
2025 Scope 1 and Scope 2 Emissions1
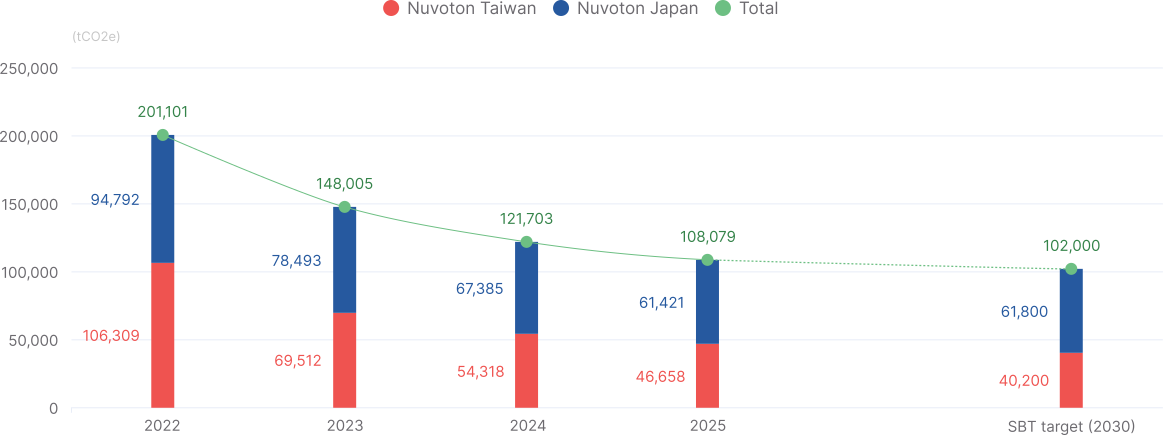
In 2025, Nuvoton's total Scope 1 and Scope 2 greenhouse gas emissions 1 amounted to 109,466 tCO₂e, representing a decrease of 14,061 tCO₂e, or 11.4%, compared with 2024. Of the total emissions, direct emissions (Scope 1) accounted for 27,699 tCO₂e, while indirect emissions (Scope 2) accounted for 81,767 tCO₂e. Nuvoton continued to advance energy management and various carbon reduction initiatives to reduce carbon emissions generated from its operations. In 2025, Scope 1 and Scope 2 emissions had decreased by 46% compared with the SBT baseline year of 2022. By region, Scope 1 and Scope 2 greenhouse gas emissions were 46,658 tCO₂e for Nuvoton Taiwan, 61,421 tCO₂e for Nuvoton Japan, and 1,388 tCO₂e for other overseas subsidiaries.
1 All GHG data disclosed in this section are aligned with SBT target setting and calculated using GWP from IPCC AR6 (2021)
Scope 1 & 2 Emissions for Nuvoton Taiwan & Nuvoton Japan (Past Four Years) & 2030 Target (tCO₂e)2
2 All GHG data disclosed in this section are aligned with SBT target setting and calculated using GWP from IPCC AR6 (2021).
2025 Scope 3 Emissions (tCO₂e)3
In 2025, Nuvoton's total Scope 3 greenhouse gas emissions amounted to 7,000,013 tCO₂e, representing a decrease of 14.3% compared with the previous year and a decrease of 16.8% compared with the 2023 baseline year. In 2025, the Company’s major sources of Scope 3 emissions were Category 1: Purchased Goods and Services (3.5%) and Category 11: Use of Sold Products (91%), which together accounted for 94% of total Scope 3 emissions.
Scope 3 Emissions by Category (Past Three Years)
3 Note: All Scope 3 data for 2025 have undergone third-party verification. For years prior to 2025, data for Scope 3 Categories 10–12 have not yet been subject to third-party verification, whereas all other applicable Scope 3 categories have been verified by third parties.
GHG Reduction Measures
Nuvoton adopts diversified and concrete carbon reduction measures tailored to different scopes of emissions.
In Taiwan, Scope 1 emissions primarily arise from fluorinated greenhouse gases generated during manufacturing processes. To reduce direct emissions, the Company continues to implement process improvements and progressively install F-GHG abatement equipment, thereby enhancing the effectiveness of greenhouse gas treatment. As of the end of 2025, the Company had achieved a maximum reduction rate of 88% for fluorinated greenhouse gases. In 2025, overall Scope 1 emissions decreased by 6,272 tCO₂e compared with 2024, representing a reduction of 30.5%.
In Japan, since 2024, Nuvoton has gradually phased out its cogeneration systems and replaced steam-driven absorption chiller units with high-efficiency electric chillers. In addition, through the shutdown of certain facilities and the optimization of energy use, the Company reduced liquefied natural gas consumption. As a result, Scope 1 emissions in Japan decreased by 4,522 tCO₂e in 2025 compared with 2024, representing a reduction of 25.2%.
Scope 1 Emissions Reduction(tCO2e)
Scope 2 Emissions Reduction(tCO2e)
Scope 2 emissions primarily arise from purchased electricity. Nuvoton actively promotes energy-saving and green energy measures to improve energy efficiency and reduce emissions associated with electricity consumption. In Taiwan, the Company continues to enhance electricity efficiency through the replacement of energy-saving equipment, such as pumps, chillers, and high-vacuum generators, as well as the installation of solar panels and the introduction of AI control into the chilled water system. In 2025, Scope 2 emissions decreased by 1,388 tCO₂e compared with 2024, representing a reduction of 4.1%.
In Japan, Nuvoton implemented various energy-saving measures, including optimizing the temperature settings of chiller units, suspending certain production equipment, and improving production processes and central air conditioning systems. The Company also adopted high-efficiency heat exchangers, closed employee dormitories, replaced lighting with LEDs, and progressively upgraded energy-saving equipment, such as pumps, chillers, and air handling units. In addition, Nuvoton Japan increased the use of renewable energy through green electricity procurement, Power Purchase Agreements (PPAs), and off-site solar energy supply. As a result, Scope 2 emissions decreased by 1,442 tCO₂e in 2025 compared with 2024, representing a reduction of 2.9%.
Scope 3 Emissions Reduction(tCO2e)
For Scope 3 emissions, Nuvoton focuses on emissions management across the supply chain and the product use phase. At the upstream level, the Company requires major suppliers to conduct carbon inventories and establish carbon reduction plans. Through supply chain carbon emissions monitoring and management, Nuvoton guides suppliers in jointly advancing the low-carbon transition. At the product level, Nuvoton integrates low-power design and product energy-efficiency improvements to reduce greenhouse gas emissions generated during the product use phase. In 2025, total Scope 3 emissions decreased by 14.3% compared with 2024 and by 16.8% compared with the baseline year (2023).
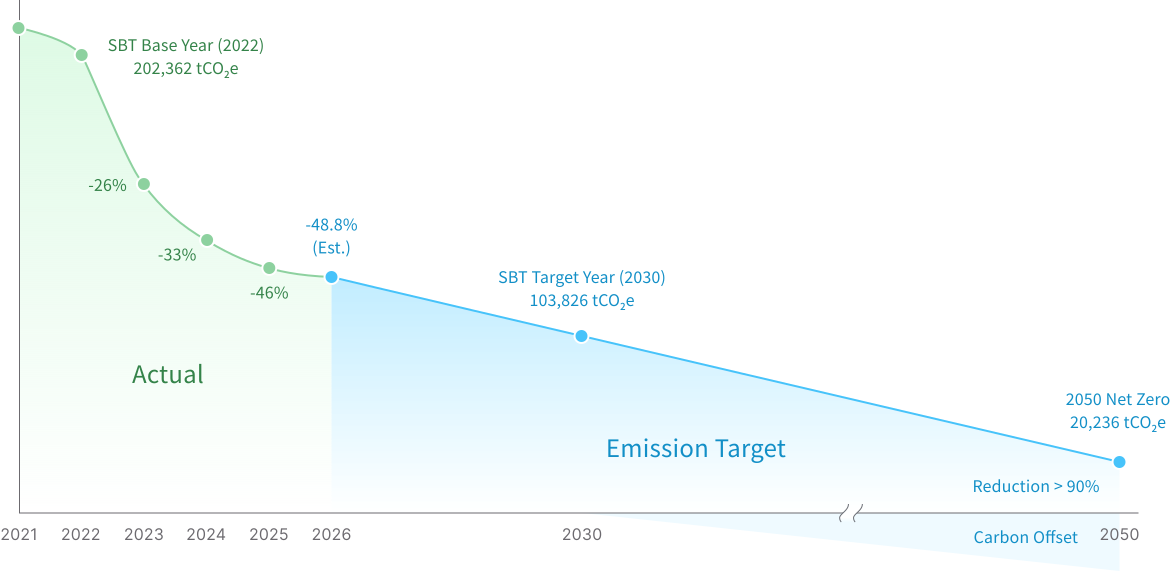
Reduction Target Setting Nuvoton follows the Science Based Targets initiative (SBTi) standards, committing to net-zero carbon emissions by 2050. The company submitted its 2030 targets to SBTi in October 2024 and received short-term target approval on March 28, 2025.
Carbon Reduction Targets and Net-Zero Commitment
By 2030
Scope 1 & Scope 2: Reduce emissions by 48.8% compared to the 2022 baseline year (SBTi-approved).
By 2030
Scope 3: Reduce emissions by 25% compared to the 2023 baseline year (SBTi-approved).
By 2050
Achieve net carbon zero as a 2050 long-term commitment.
Nuvoton (Global) Net Carbon Zero Pathway
2025 Nuvoton Taiwan's Greenhouse Gas Reduction Project
| Company | Category | Investment Amount (NT$ thousand) | Electricity Savings (kWh/year) | Energy Savings (GJ/year) | Carbon Reduction (tCO₂e/year) |
|---|---|---|---|---|---|
| Nuvoton Taiwan | Introduction of AI control into the chilled water system | 740 | 730,000 | 2,628 | 346 |
| Air compressor operation optimization | - | 51,264 | 185 | 24 | |
| Replacement of outdated equipment (lighting, chillers, pumps, vacuum systems, etc.) | 35,445 | 536,139 | 1,930 | 254 | |
| Self-generated renewable energy | 180 | 1,028,683 | 3,703 | 488 | |
| Total | 36,365 | 2,346,086 | 8,446 | 1,112 | |
2025 Nuvoton Japan's Greenhouse Gas Reduction Project
| Company | Category | Investment Amount (NT$ thousand) | Electricity Savings (kWh/year) | Energy Savings (GJ/year) | Carbon Reduction (tCO₂e/year) |
|---|---|---|---|---|---|
| Nuvoton Japan | Smart Energy Management | - | 80,645 | 290 | 34 |
| System Supply Optimization (AC optimization, production consolidation, and dormitory consolidation) | 10,357 | 877,839 | 3,160 | 371 | |
| Replacement of Outdated Equipment | 3,390 | 423,581 | 1,525 | 179 | |
| Introduction of renewable energy | - | 1,433,625 | 5,161 | 606 | |
| Total | 13,747 | 2,815,690 | 10,136 | 1,190 | |