Environmental Sustainability|Water Management


Nuvoton actively reduce the environmental impact of our business operations by investing in innovative technologies and initiating layouts for renewable energy and net carbon zero emissions. We enhance resource use efficiency and implement waste management to respond to the continuously evolving international environmental regulations, extreme climate events, and other risks. By estimating financial impacts and planning management costs in advance, we formulate environmental strategies and build operational resilience for the company.


48.8
%
Approved SBTi Near-Term Target: Commitment to Reduce Scope 1 and 2 Emissions by 2030 Compared to the 2022 Baseline
25
%
Approved SBTi Near-Term Target: Commitment to Reduce Scope 3 Emissions by 2030 Compared to the 2023 Baseline
1163000
kWh
Nuvoton Taiwan's Annual Electricity Saving Achievement in 2024
Water Resource Management
Nuvoton is committed to sustainable water resource management, adhering to two core strategies: "Reducing Usage at the Source" and "Recycling and Reuse at the Back End." These approaches aim to minimize water consumption and ensure stable supply. Each year, we set water usage targets, implement related programs, and regularly review progress and effectiveness. For items that fail to meet targets, we conduct analysis and corrective actions to ensure the effectiveness of water resource management.
Water-Saving Measures and Reduction Performance
%
Nuvoton Taiwan actively implements various water-saving measures, achieving 3.7% reduction in water usage in 2024 compared to the previous year.
%
Nuvoton Japan optimized plant water allocation and adjustments, resulting in a 12.3% reduction in 2024 compared to the previous year, saving a total of 493 million liters of water.
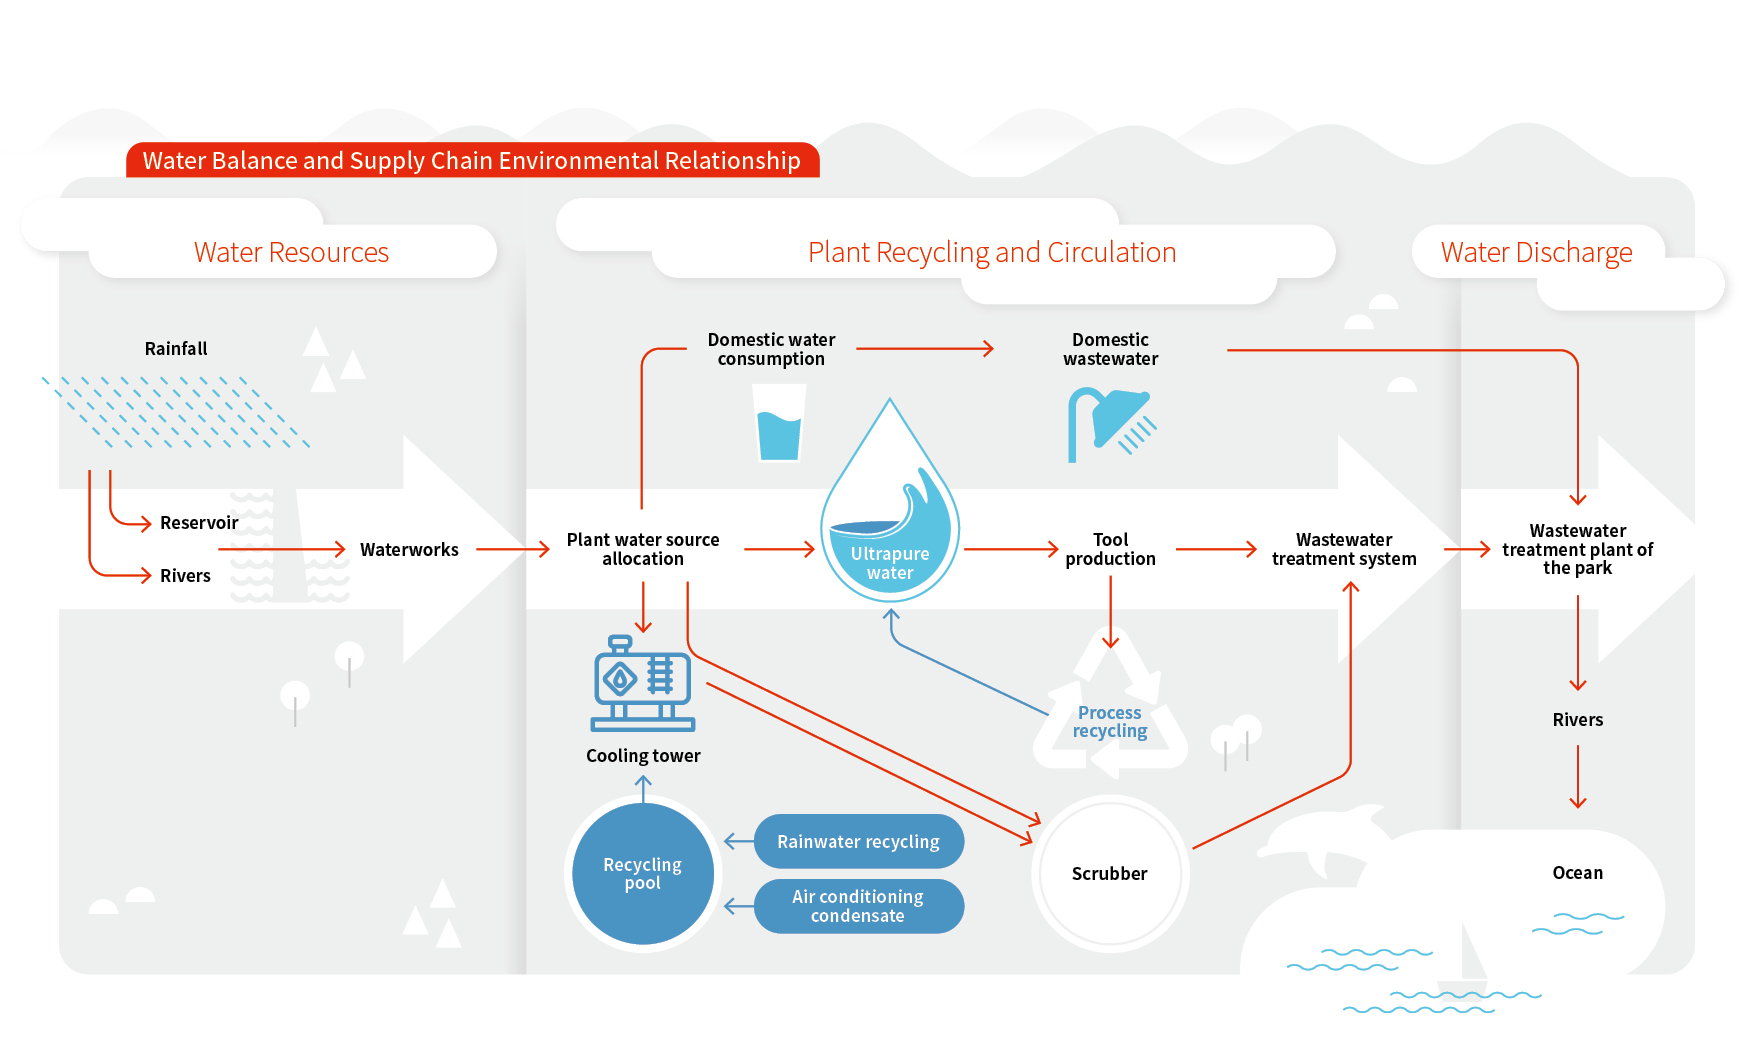
Water Sources and Water Recycling
In 2024, Nuvoton Taiwan's water source distribution is primarily composed of tap water provided by the water company (85%), with a minor portion consisting of recycled rainwater and air conditioning condensate used as secondary water (15%). The water recycling rate at the production site, calculated based on the water balance chart submitted to the Hsinchu Science Park Administration, stands at approximately 68% for the entire factory. Nuvoton Japan's water sources include tap water (0.6%), industrial water (1.0%), and groundwater (98.0%).
Water Resource Usage1, 2
Unit: million liters/year
| Nuvoton Taiwan | Nuvoton Japan | |||||
|---|---|---|---|---|---|---|
| Year | Water withdrawal3 | Drainage | Water consumption | Water withdrawal3 | Drainage | Water consumption |
| 2021 | 397 | 319 | 79 | 5,307 | 5,039 | 269 |
| 2022 | 414 | 312 | 102 | 4,856 | 4,595 | 262 |
| 2023 | 402 | 317 | 85 | 4,003 | 3,746 | 256 |
| 2024 | 424 | 318 | 106 | 3,510 | 3,273 | 237 |
1 The scope of water resource statistics covers Nuvoton Taiwan and Nuvoton Japan, neither of which sources water from water-stressed areas.
2 The data information here has been recompiled and the adjustment instructions compared with the previous year's report are detailed in Appendix 3.
3 Nuvoton Taiwan's water sources for tap water are third-party water and surface water, with no water coming from groundwater or seawater. The third-party water source comes from surface water (freshwater ≤1,000 mg/L total dissolved solids). The total water withdrawal is calculated as the sum of surface water (total), groundwater (total), seawater (total), and third-party water (total).
Water Risk Management
Nuvoton applies the World Resources Institute (WRI) "Aqueduct Water Risk Atlas" for water risk assessment. Results indicate that both Nuvoton Taiwan and Nuvoton Japan production sites do not source or consume water from areas classified as high or extremely high water stress, and no seawater is used. This demonstrates that the company's impact on local water resources is relatively low.To address upstream and downstream risks, we implement the following measures:
Upstream Risks
Nuvoton Taiwan reviews reservoir conditions monthly. When effective water volume falls below the alert level, we activate external water sourcing procedures. Nuvoton Japan regularly monitors well water levels to ensure stable supply.
Downstream Risks
Taiwan constantly keep updated with the inclusion standards of the Science and Technology Management Bureau, continuously monitoring related discharge data within the plant, and the management bureau regularly dispatches personnel for water sampling audits to ensure that discharged wastewater meets requirements.
Water Quality Management and Discharge
Nuvoton places great emphasis on wastewater treatment and water quality management, ensuring all discharges comply with government regulations and Hsinchu Science Park standards. Our main operating site is located in the Hsinchu Science Park, with a total discharge volume of 318 million liters, and no incidents of wastewater leakage. Wastewater sources include process operations and domestic use, treated as follows:
Process Wastewater
Primarily generated from cleaning, thin-film formation, etching, developing, and diffusion processes. Classified into acidic and alkaline wastewater, fluorinated wastewater, and grinding wastewater. Multiple treatment technologies are applied, including acid-base neutralization and calcium chloride coagulation and sedimentation, ensuring water quality meets Water Pollution Control Standards before being discharged to the Hsinchu Science Park Wastewater Treatment Plant.
Domestic Wastewater
Conveyed through the sewer system to the Hsinchu Science Park Wastewater Treatment Plant, and ultimately discharged into Keya Creek.
To ensure water quality safety, Nuvoton conducts semi-annual sampling and analysis. Test results consistently meet discharge standards, and we cooperate with regular audits by the Hsinchu Science Park Administration to maintain stable effluent quality.
Nuvoton Taiwan Discharge Water Quality in the Past Two Years
| Discharge Water Components | Unit | Inclusion Standards | 2023 First Half | 2023 Second Half | 2024 First Half | 2024 Second Half |
|---|---|---|---|---|---|---|
| Suspended Solids | mg/L | 300 | 4 | 3 | 36 | 167 |
| Chemical Oxygen Demand (COD) | mg/L | 500 | 26 | 34 | 74 | 50 |
| Fluoride | mg/L | 15 | 5 | 3 | 11 | 14 |
| Ammonia | mg/L | 50 | 10 | 8 | 14 | 8 |
| Nitrate Nitrogen | mg/L | 50 | 3 | 0.5 | 5 | 16 |